

In response to elevated levels of inflation, the Federal Reserve (Fed) has raised the federal funds rate by 5.25% to a current range of 5.25% – 5.50%. While there have been some bumps in the road, including two negative quarters of real GDP growth (Q1 & Q2 2022) and a banking crisis (March 2023), the U.S. economy has performed surprisingly well. This is underscored by the most recent GDP report, with real GDP growth of 5.2% in Q3 2023.1 Moreover, the estimate of Q4 2023 real GDP growth provided by the Atlanta Fed (GDPNow) is 1.8% as of November 30, 2023.2 As for inflation, it continues to moderate based on measures such as the CPI and the PCE Price Index. In October, the CPI was unchanged (0%) and increased 3.2% year-over-year (Core CPI increase of .2% and 4% year-over-year).3 This is down from a peak year-over-year rate of 9.1% in June 2022 (Core CPI peak year-over-year rate of 6.6% in September 2022).4 The PCE Price Index was also unchanged in October (0%) and increased 3% year-over-year (Core PCE Price Index increase of .2% and 3.5% year-over-year).5 While the Fed had penciled in another .25% increase in the federal funds rate according to the September Summary of Economic Projections (2023 median federal funds rate of 5.6%)6, an increase at the December FOMC meeting is unlikely. Based on the trends in the inflation data, the Fed can remain on hold and maintain the target range for the federal funds rate at 5.25% – 5.50%.
Reviewing the major U.S. stock market indexes, 2023 has been a good year. Shown below are the year-to-date returns as of November 30, 2023 (price performance, dividends not included).
| U.S. Stock Market Index | Year-To-Date Return |
|---|---|
| Dow Jones Industrial Average | 8.46% |
| Nasdaq Composite | 35.92% |
| Nasdaq 100 | 45.78% |
| S&P 500 | 18.97% |
| S&P 400 | 5.48% |
| S&P 600 | 1.13% |
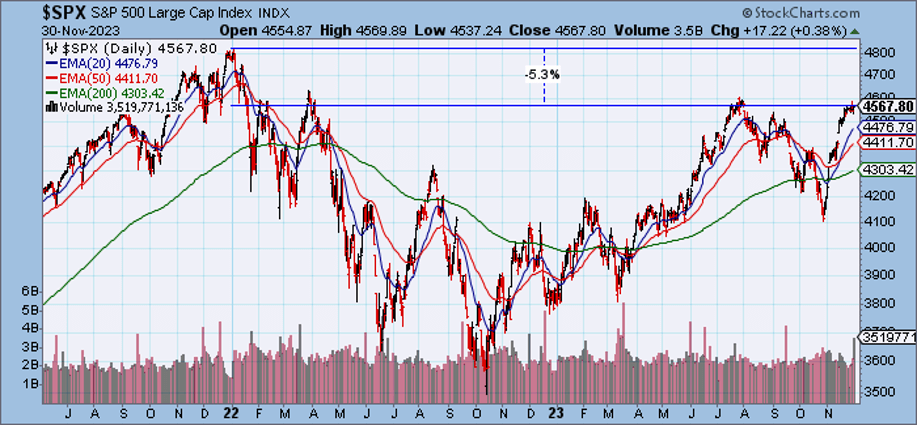
Shown below is a chart of the S&P 500. The index is down about 5.3% from its all-time high set in January 2022. (Of note, when taking dividends into account, total return S&P 500 ETFs such as the VOO (Vanguard S&P 500 ETF) or the SPY (SPDR S&P 500 ETF) are down a little over 2% from their all-time high price points set in January 2022.)
Reviewing the S&P 500 sectors via the SPDRs, the consumer discretionary, technology, and communication services sectors have performed well in 2023. Shown below are the year-to-date returns as of November 30, 2023 (price performance, dividends not included).
| S&P 500 Sector SPDR | Year-To-Date Return |
|---|---|
| Consumer Discretionary | 30.68% |
| Consumer Staples | -5.22% |
| Energy | -3.30% |
| Financials | 4.97% |
| Health Care | -3.34% |
| Industrials | 9.00% |
| Materials | 6.09% |
| Real Estate | .81% |
| Technology | 48.79% |
| Communication Services | 45.38% |
| Utilities | -10.98% |
Are we there yet? Are we at the peak in the federal funds rate? Based on recent market commentary and the action in financial markets, the answer is yes. As compared to a month ago, U.S. Treasury yields are materially lower, U.S. equity markets are materially higher, and cuts in the federal funds rate at being priced into the market. Based on the CME FedWatch Tool, cuts could come as soon as January 2024 with a 7.9% probability of a .25% decrease in the federal funds rate (to a target range of 5.00% – 5.25%).7 While the Fed is on hold, points noted in previous articles regarding past inflationary experiences will still influence the Fed’s thinking. Optimism about federal funds rate cuts has been misplaced in the past and may again be misplaced. At this point, I believe the December FOMC meeting is important. How will Chairman Powell characterize inflation and monetary policy? Is inflation still “too high” and “well above” the 2% target? Is there still “a long way to go” in the inflation fight? Is the Fed now confident that policy is sufficiently restrictive? Is further tightening still under consideration? In addition, the December Summary of Economic Projections will be important to assess the Fed’s thinking on key economic variables, including the federal funds rate. With the Fed on hold, we are at a peak. But is it the peak? More data is needed to conclusively answer this question. The Fed’s positioning and the economic data will determine if we are at the peak in the federal funds rate, key considerations as we move into 2024.
Thanks for reading.
Phillip B. Kaiser, CFA, CFP®, CMT®
Notes
1. U.S. Bureau of Economic Analysis, Gross Domestic Product (Second Estimate) Corporate Profits (Preliminary Estimate) Third Quarter 2023. Accessed on Thursday, November 30, 2023 from https://www.bea.gov/news/2023/gross-domestic-product-second-estimate-corporate-profits-preliminary-estimate-third.
2. Federal Reserve Bank of Atlanta, GDPNow Model. Accessed on Thursday, November 30, 2023 from https://www.atlantafed.org/cqer/research/gdpnow.
3. U.S. Bureau of Labor Statistics, Consumer Price Index – October 2023. Accessed on Thursday, November 30, 2023 from https://www.bls.gov/news.release/cpi.nr0.htm.
4. U.S. Bureau of Labor Statistics, 12-month percentage change, Consumer Price Index, selected categories. Accessed on Thursday, November 30, 2023 from https://www.bls.gov/charts/consumer-price-index/consumer-price-index-by-category-line-chart.htm.
5. U.S. Bureau of Economic Analysis, Personal Income and Outlays – October 2023. Accessed on Thursday, November 30, 2023 from https://www.bea.gov/news/2023/personal-income-and-outlays-october-2023.
6. Board of Governors of the Federal Reserve System, Summary of Economic Projections – September 20, 2023. Accessed on Thursday, November 30, 2023 from https://www.federalreserve.gov/monetarypolicy/files/fomcprojtabl20230920.pdf.
7. CME Group, CME FedWatch Tool. Accessed on Thursday, November 30, 2023 from https://www.cmegroup.com/markets/interest-rates/cme-fedwatch-tool.html?redirect=/trading/interest-rates/countdown-to-fomc.html.