

In my previous article dated November 30, 2023 (Are We There Yet?), I highlighted the optimism regarding cuts in the federal funds rate. At the time, expectations were high that cuts would be forthcoming based on moderating inflation. Fast forward nine months and we have seen no cuts in the federal funds rate. The target range that existed in November 2023 is still the target range that exists today, 5.25% – 5.50%. With recent weakness in the labor market, expectations are again high that cuts will be forthcoming. Moreover, commentary from Fed Chairman Jerome Powell at the 2024 Jackson Hole Economic Symposium hinted at a cut at the September FOMC meeting (September 18th). While a cut may be in the cards in September, the current economic backdrop does not seem to justify too much optimism, especially as we move past September. While the unemployment rate has increased to 4.2%1, measures of inflation, while moderating, have continued to come in above the 2% target. The September CPI report indicated an all-items (headline) increase of .2% (2.4% annualized and 2.5% increase year-over-year) and a core increase of .3% (3.6% annualized and 3.2% increase year-over-year).2 Additionally, overall measures of U.S. economic activity are doing fine. The Q3 2024 estimate of real GDP growth provided by the Atlanta Fed (GDPNow) is 2.5% as of September 9, 2024.3 The ISM services PMI registered 51.5 in August.4 As for manufacturing, the ISM PMI registered 47.2 in August, indicating contraction.5 But this is not new as ISM manufacturing readings have been weak for over a year and a half. Based on these data, it is questionable as to whether a cut is needed, but if so, a .25% reduction in the federal funds rate seems appropriate (target range of 5.00% – 5.25%).
Reviewing the major U.S. stock market indexes, 2024 has been a good year. Shown below are the year-to-date returns as of September 11, 2024 (price performance, dividends not included).
| U.S. Stock Market Index | Year-To-Date Return |
| Dow Jones Industrial Average | 8.42% |
| Nasdaq Composite | 15.88% |
| Nasdaq 100 | 14.33% |
| S&P 500 | 16.44% |
| S&P 400 | 6.41% |
| S&P 600 | 1.17% |
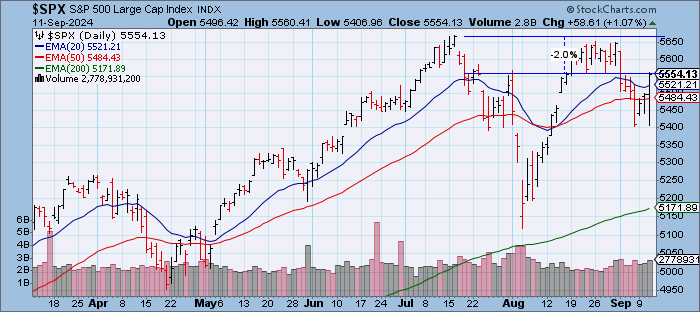
Shown below is a chart of the S&P 500. The index is down about 2% from its all-time high set in July 2024.
Reviewing the S&P 500 sectors via the SPDRs, many sectors have performed well in 2024 with the top three being utilities, financials, and communication services. Shown below are the year-to-date returns as of September 11, 2024 (price performance, dividends not included).
| S&P 500 Sector SPDR | Year-To-Date Return |
| Consumer Discretionary | 5.73% |
| Consumer Staples | 14.99% |
| Energy | .61% |
| Financials | 17.77% |
| Health Care | 13.86% |
| Industrials | 12.53% |
| Materials | 6.41% |
| Real Estate | 11.86% |
| Technology | 13.02% |
| Communication Services | 16.24% |
| Utilities | 22.03% |
Based on relatively direct commentary from Fed Chairman Jerome Powell as well as other FOMC members, a cut in the federal funds rate is a certainty at the September FOMC meeting. As of September 11th, the CME FedWatch Tool assigns an 85% probability to a .25% reduction and a 15% probability to a .50% reduction.6 As noted in the introduction, I believe a .25% reduction is appropriate. This would respond to weakness in the labor market without taking an alarmist view. Panic is not a good investment strategy and I suspect it is not a good way to run monetary policy. Moreover, the Fed is data dependent and the economic data overall still looks fine. Can things get worse? Certainly, and the Fed can respond in kind. As compared to 2022, the Fed is in a much better position to respond to economic weakness with the federal funds rate at 5.25% – 5.50%. In the event of economic weakness, the Fed has ample room to cut rates to spur economic activity. However, the kicker still continues to be inflation. While inflation has moderated, it was from extremely high levels, and the trend has not proven to be at a sustainable 2% level. The inflation target is 2%, which is roughly .17% per month. Each monthly reading or an average of several months should be roughly .17%. All-items CPI inflation has flirted with these levels at times, but core CPI inflation has stayed persistently higher. For example, the 3-month average all-items CPI inflation from October to December 2023 was .17%. However, 3-month average core CPI inflation over the same time period was .27% (3.24% annualized). More recently (June to August 2024), the 3-month average all-items CPI inflation is .1% (1.2% annualized) but 3-month average core CPI inflation is .2% (2.4% annualized). 6-month average core CPI inflation (March to August 2024) is roughly .25% (3% annualized). Based on these data, it is hard to have confidence that inflation is running at a sustainable 2% level. As such, optimism regarding rate cuts still appears to be misplaced. The Fed will cut rates at the September FOMC meeting by .25% and will most likely provide little guidance as to its path forward. It could be one and done for a while. The Fed is data dependent and until inflation is at a sustainable 2% level (or below 2% due to economic weakness), it is hard to see the Fed getting too aggressive with federal funds rate cuts.
Thanks for reading.
Phillip B. Kaiser, CFA, CFP®, CMT®
Notes
1. U.S. Bureau of Labor Statistics, Employment Situation Summary – September 2024. Accessed on Friday, September 6, 2024 from https://www.bls.gov/news.release/empsit.nr0.htm.
2. U.S. Bureau of Labor Statistics, Consumer Price Index – September 2024. Accessed on Wednesday, September 11, 2024 from https://www.bls.gov/news.release/cpi.nr0.htm.
3. Federal Reserve Bank of Atlanta, GDPNow Model. Accessed on Monday, September 9, 2024 from https://www.atlantafed.org/cqer/research/gdpnow.
4. Institute for Supply Management, Report on Business Services PMI – August 2024. Accessed on Thursday, September 5, 2024 from https://www.ismworld.org/supply-management-news-and-reports/reports/ism-report-on-business/.
5. Institute for Supply Management, Report on Business Manufacturing PMI – August 2024. Accessed on Tuesday, September 3, 2024 from https://www.ismworld.org/supply-management-news-and-reports/reports/ism-report-on-business/.
6. CME Group, CME FedWatch Tool. Accessed on Wednesday, September 11, 2024 from https://www.cmegroup.com/markets/interest-rates/cme-fedwatch-tool.html?redirect=/trading/interest-rates/countdown-to-fomc.html.